8. Demo of the model

Resolution

CWatM can be run globally at 0.5° or separately for any basin or any clipping of a global map.
Depending on the data provided the model can also run for any other resolutions (e.g. 5 arcmin).
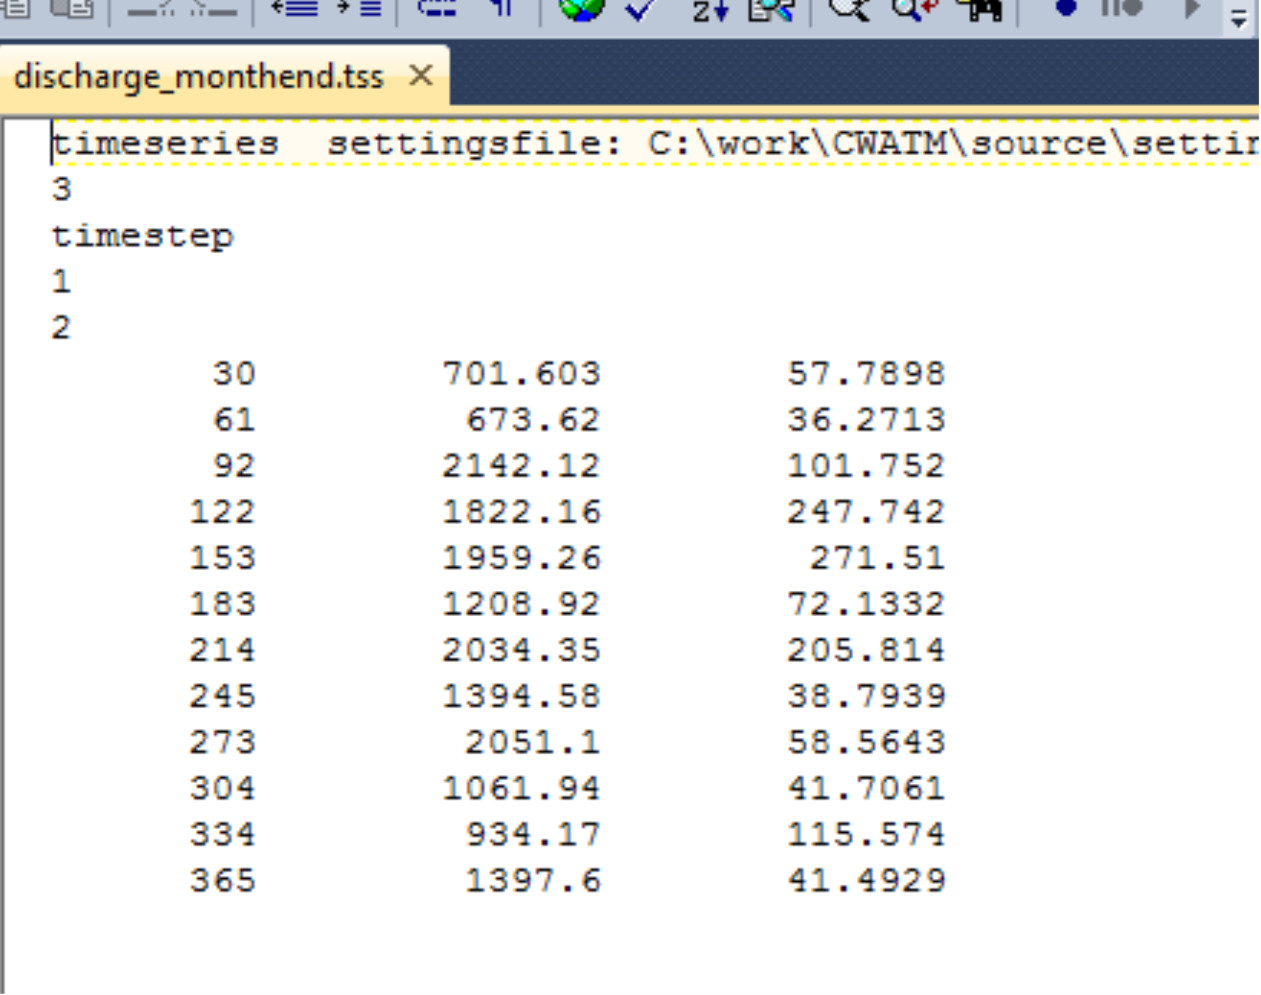
Timestep is daily, output of maps, time series can be daily, monthly, yearly

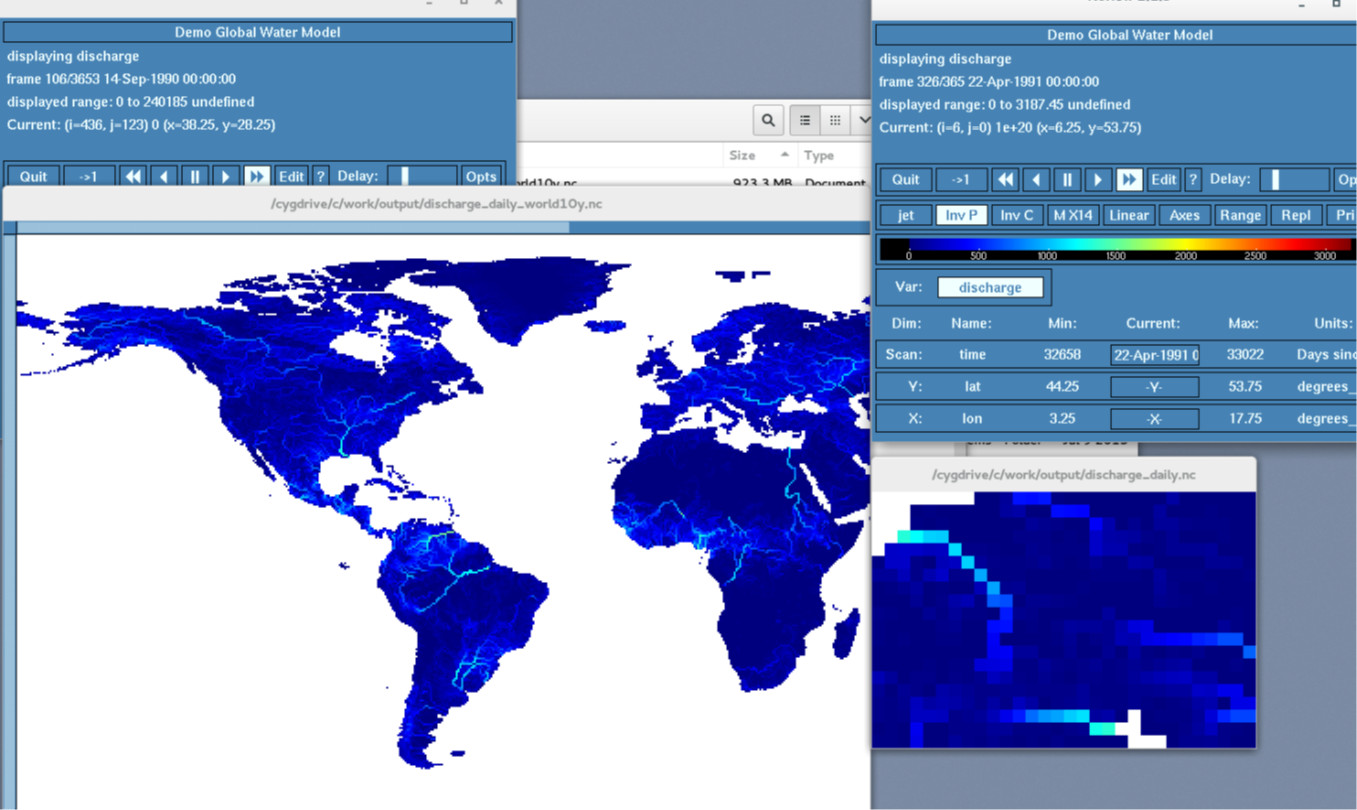
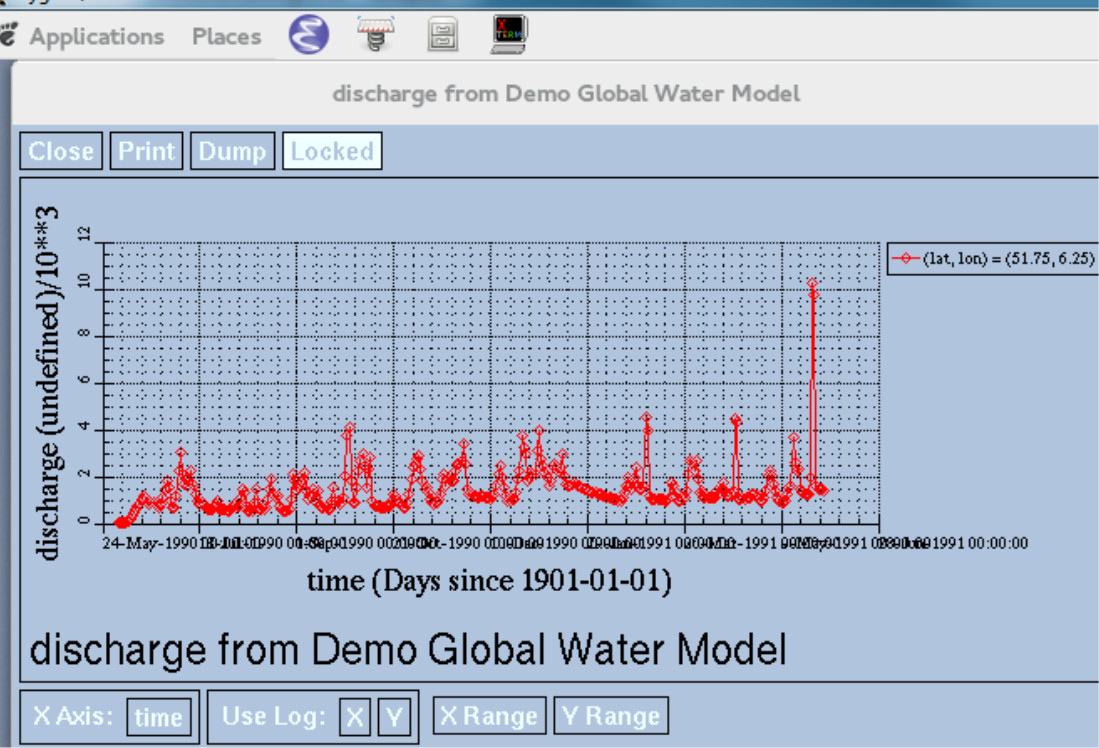
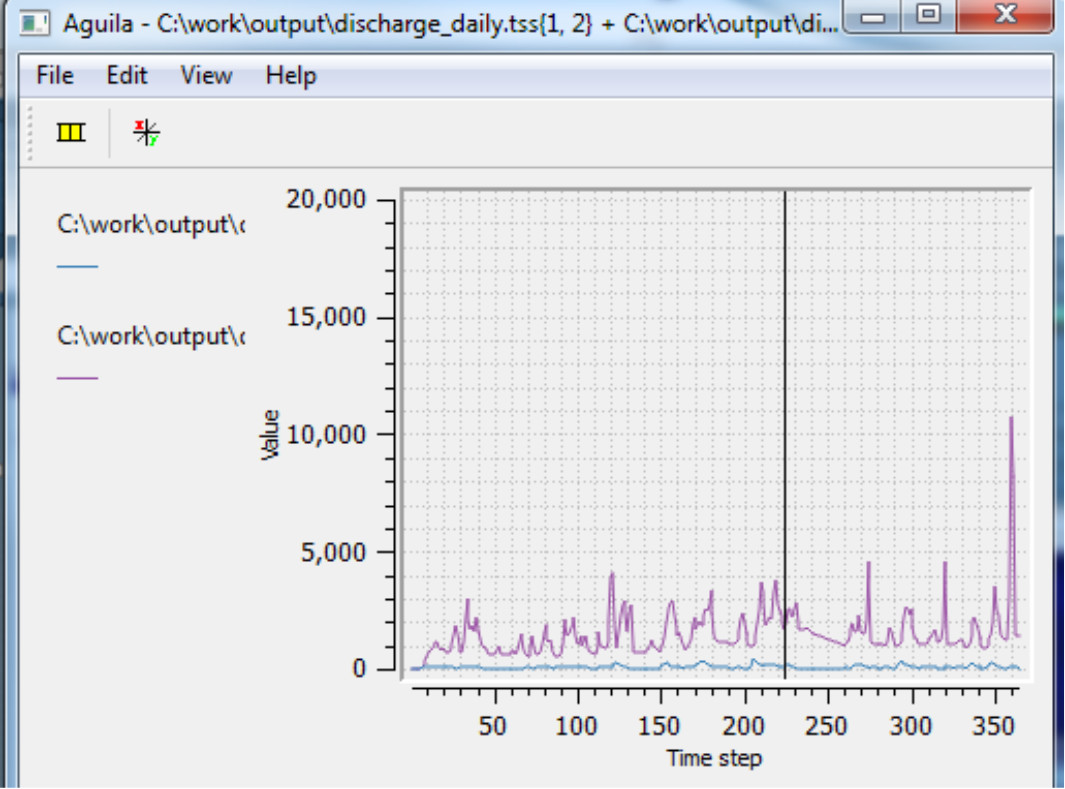
Here some outputs of the global run on 0.5° are shown:

Demo 1 - NetCDF videos

Global discharge

One year run example: 1/1/1991- 31/12/1992

Global potential evaporation [mm/day]

One year run example

Global soil moisture [mm/mm]

One year run example

Demo 2 - NcView output

Global discharge as world map
Output from NcView
_images/demo1_ncview.jpg

Demo 3 - NcView timeserie

Discharge as timeseries
Output from NcView
_images/demo2_ncview.jpg

Demo 4 - Monthly timeserie

Discharge as monthly timeseries

_images/demo3_timeserie.jpg

Demo 5 - PCRaster Aguila output

Discharge as timeseries Output from PCRaster Aquila

_images/demo4_ts_aguila.jpg